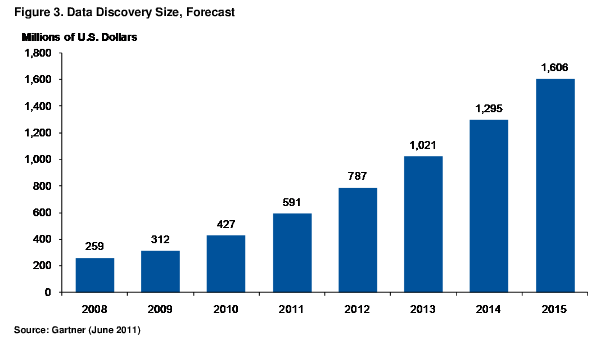
Visualization-based data discovery tools may account for less than 5 % of the Business Intelligence (BI) Market, but they are fighting above their weight in terms of profile. In 2011, Gartner placed Visualisation at the peak of the BI Hype Cycle. Despite this indicating the category may lose some of its lustre , Gartner are still predicting a compound annual growth rate of 30% in each of next 5 years. If true, this means the category will increase in value from $427 to $1,606 million over the period, a growth rate 3 times that of the overall BI market.
So what are Data Visualisation tools and how are they defined?
According to Gartner, there are 3 common elements
- An intuitive interface that enables users to explore data without much training.
- A proprietary data structure to store and model data gathered from disparate sources, which minimizes reliance on predefined drill paths and dimensional hierarchies.
- A built-in performance layer that obviates the need for aggregates, summaries, and pre-calculations.
Who are the main vendors in the Data Visualisation category?
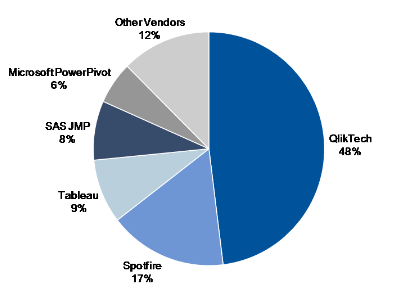
Gartner ranked the leading players, based on estimated revenue, to be
- Qlikview – $ 205 million
- Tibco Spotfire – $70.5 million
- Tableau – $38 million
- SAS (JMP) – $35 million
- Microsoft PowerPivot – $25 million.
- Microstrategy Visual Insight (only released mid –2011)
- Advizor Solutions. <$ 10 million.
With the expected growth of this category, large traditional BI vendors like Microsoft are scrambling for market share. Microsoft’s recently released PowerView (formerly codenamed project crescent) an example of a traditional BI company entering this category.
So why the growth and hype in the Category?
Several factors appear to be driving the high pace of adoption.
Usability —Usability is the No. 1 selection criterion when choosing BI tools, according to Gartner’s “Magic Quadrant for Business Intelligence Platforms. Strong visualization capabilities, intuitive user interfaces and fast query times put visualization tools in this usability sweet spot.
Time to deliver — A light footprint means these tools can typically be deployed quicker than traditional BI platforms. This is particularly attractive for departmental type implementations where enterprise scale BI solutions can feel like an overkill. The speed to deliver can be particularly quick when Visualisation tools are provided via Software as a Service (SaaS).
Efficient proof of concept : Sales organizations often can do proof-of-concepts much more quickly, thereby shortening the sales cycles.
The promise of being able to cut through to answers. Visualization–analytics are often sold on the promise of being flexible enough to answer multiple questions and ultimately answer business problems much quicker than traditional BI tools.
Traction in segments with low Business Intelligence penetration. Small and midsize businesses (SMBs) with a scarcity of resources and skills often find visual data discovery tools good enough to meet their BI needs. Low risk SaaS, and per user, pricing models also help with uptake in the SMB space.
Rapid prototyping. An upswing in the adoption of agile methodologies has set the stage for rapid prototyping to be done in data discovery tools. Often user friendly Graphical User Interfaces mean a business user can generate analyses that traditionally have only be possible with help from IT.
Sales focus on business users as opposed to IT/developers. This has opened up a new segment of the market for Business Intelligence.
Mobile BI – Many visualisation analysis tools have been developed with mobile devices in mind. Mobilility is a hot category, so being mobile capable is natural selling point. The tap and swipe functionality of tablets are perfectly suited to visual- analysis and playing with data.
Performance. Improvements in computer processing and the move to 64 bit has enabled data discovery tools to store and manipulate large amounts of information in-memory, freeing it from large underlying information infrastructures.
Viral spread— Users who like working in the data discovery tools recommend it to their peers and take it with them when they move to new roles and responsibilities
Disillusionment with traditional BI. Traditional BI is often thought to be expensive and slow to deliver a ROI. A perceived disconnect between what IT delivers and business users want has lead business users to take the initiative to take more ownership of analytics. Visual Analytics is easier to own than traditional BI infrastructures with its ETL processes, multidimensional data warehouses, large report library’s etc.)
Issues /challenges with Visualisation tools
Multiple versions of the truth. Visualisation data discovery tools are regularly being sold directly to business units and business users. This is in contrast to the traditional BI sales into IT. This can lead to multiple spreadmarts springing up, and multiple versions of the truth. The flip side is that much of this can be managed and controlled if there is collaboration between the business and IT. So IT implements and manages the solution, metadata libraries & business glossaries.
Here is an demonstration on how quick you can build and deploy a simple web facing dashboard using Tibco Spotfire Silver. The video is about 20 minutes long, but if you just want to see how the tool works, I do a demo about 1-2 minutes into the video.
.png)


Great tutorial. Do you plan to have a continuation (Iibco spotfire tutorial 2) available soon?
Thanks for the feedback. Yes I will be doing the follow up Tibco Tutorial soon- I am hoping within the next 2-3 weeks.
hi.
thanks for your work.
could you kindly share the files you used in your video 1 (excel, spotfire) and are you still planning to release the other 2?
Thanks a lot again.
Danilo
Hi Danilo, thanks for the message. I am just about to start work on the part 2 of the spotfire video and should have the released in the next couple of weeks. I will share the underlying files as a part of that post. Cheers Steve