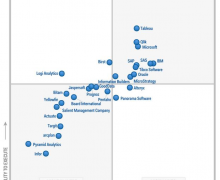
In many businesses, where IT is struggling to keep up with businesses data demands, rifts are developing between business users and IT. Rightly or wrongly more business users are assuming ownership of data and Business Intelligence and creating their own...
Association Rules are a quick and simple technique to identify groupings of products that are often sold together. This makes them useful for identifying products that could be grouped together in cross-sell campaigns. Association rules are also known as Market...
The amount of spatial data captured in databases is increasing exponentially. This includes data from mobile phones, GPS units through to home detention bracelets used for home arrests. Typically these devices capture information such as latitudes and longitudes. The spatial capabilities of...
Powerpivots are a great tool for exploring data and drilling down into trends and patterns. However as you drill down into subsets of the data, sample sizes decrease and you need to be cautious as to how you interpret...
Pareto analysis is a handy analysis to help clarify how to allocate resources. The basic idea to to identify a small proportion of items or results that are disproportionally responsible for the overall outcome. For example the 20% of customers that are...
